What Do Twitter Engagements Mean? Complete 2026 Guide
What do Twitter (X) engagements mean: definitions, algorithmic weights, quality vs vanity engagement, and the workflow that turns engagement understanding into growth.

The question of what do Twitter engagements mean sits at the foundation of every growth strategy on X in 2026. Engagement is the platform's primary signal of content value, the metric the algorithm uses to decide reach, the number that determines whether your account compounds or stagnates. With median engagement on X at 0.015% and the 2026 algorithm aggressively rewarding specific engagement types over others (retweets up 35% YoY, replies up 21%, profile clicks down 31%), the meaning behind engagement numbers is more nuanced than ever.
This guide answers what do Twitter engagements mean in 2026 in depth: what an engagement is (every interaction type), what engagement signals to the algorithm, what engagement signals to your audience, how to interpret engagement counts in context, the differences between vanity engagement and quality engagement, and the workflow that turns engagement understanding into growth. Whether you are new to X or have been posting for years, separating the signal from the noise is essential.
Engagement Defined: The Mechanical View
X's official definition: an engagement is any user interaction with a tweet. Specifically, nine types count.
The Nine Engagement Types
- Likes (heart tap)
- Replies (comments on the tweet)
- Retweets (reposts to the user's followers)
- Quote tweets (retweets with added commentary)
- Bookmarks (saved for later, hidden from author)
- Link clicks (any external link in the tweet)
- Profile clicks (visitor clicks through to your profile)
- Hashtag clicks
- Media views (image or video)
Each interaction increments your engagement count by one. Total engagement is the sum across all types. Engagement rate is total engagement divided by total impressions.
What Engagements Mean to the Algorithm
The X algorithm uses engagement to decide content distribution. Three layers of meaning.
Layer 1: Engagement as Quality Signal
High engagement signals that real users find content valuable. The algorithm uses this signal to decide whether to amplify the post to non-followers in the For You feed.
Layer 2: Engagement Type as Weight Signal
Not all engagement types carry equal weight in 2026.
| Type | 2026 YoY Change | Algorithmic Weight |
|---|---|---|
| Likes | +8% | Low |
| Replies | +21% | High |
| Retweets | +35% | Very high |
| Quote tweets | +28% | Very high |
| Bookmarks | +15% (est.) | High |
| Profile clicks | -31% | Medium |
| Xarmy verified engagement | — | Multiplies all types |
Layer 3: Engagement Velocity as Strongest Signal
Engagement in the first 30 minutes after publish carries 5-10x more weight than later engagement. According to Digital Applied's 2026 marketing report, posts hitting 50+ engagements in the first 30 minutes are 10-20x more likely to break out than slow-starting posts.
What Engagements Mean to Your Audience
Beyond the algorithm, engagement counts are read by visitors as social proof.
Low Engagement on Recent Posts
Profile visitors who see 0-5 likes on recent posts assume low audience interest. Reduces follow conversion.
Moderate Engagement
50-500 engagements on recent posts signals an active, engaged account. Drives follow consideration.
High Engagement
1,000+ engagements signals viral capability and audience reach. Strong follow driver and credibility booster.
Engagement Composition
Visitors notice not just total count but composition. 100 likes with 30 substantive replies reads as a healthy engaged audience. 1,000 likes with 2 replies reads as audience that lurks but doesn't connect.
According to Sprout Social's 2026 industry data, accounts with high reply-to-like ratios convert profile visitors to followers 2-3x faster than accounts with low ratios at identical follower counts.
Vanity vs Quality Engagement
The most common engagement misunderstanding: confusing impressive numbers with meaningful signal.
Vanity Engagement (Low Quality Signal)
- Likes from accounts with no profile history
- One-word replies ("this", "agreed", "👌")
- Retweets from bot networks
- Reply spam from new accounts
- Inflated counts from engagement pods
Quality Engagement (High Signal)
- Substantive replies (multiple words, original thought)
- Quote tweets with thoughtful commentary
- Retweets from accounts in your niche
- Bookmarks (real users saving for later)
- Profile clicks leading to follows
The algorithm distinguishes these. 50 quality engagements outperforms 500 vanity engagements for reach amplification. Some bot-driven services that promise "10,000 engagements/month" actually damage accounts because the engagement gets flagged as inauthentic.
What Specific Engagement Numbers Mean
Reading engagement counts in context requires comparing against benchmarks.
Engagement Rate Benchmarks
According to Sprout Social's 2026 industry data: median brand engagement is 0.015%. Sports accounts top brand categories at 0.073%. Individual creators routinely achieve 1-5%. Exceptional creator accounts sustain 5%+ engagement rate.
Absolute Engagement Benchmarks (Per Post)
- New account (under 1K followers): 5-20 engagements per post is solid
- Growing creator (1K-10K): 30-150 engagements per post
- Established creator (10K-100K): 200-1,500 engagements per post
- Major creator (100K+): 1,000-10,000+ engagements per post
Use our engagement rate calculator guide for math and benchmark comparisons.
How to Drive Specific Engagement Types
Strategic content drives specific engagement types based on your growth goal.
To Drive Retweets (Highest 2026 Algorithm Weight)
- Specific numbers and concrete data
- Frameworks and mental models
- Surprising statistics that challenge assumptions
- Quotable single-tweet insights
- Strong threads with shareable takeaways
To Drive Replies (Conversation Density)
- Open-ended questions about niche topics
- Contrarian opinions inviting debate
- Personal stories prompting reactions
- Polls with thoughtful options
- Calls for examples from audience
To Drive Bookmarks (Hidden Quality Signal)
- Reference content (lists, frameworks, resources)
- Step-by-step tutorials
- Tool comparisons
- Industry-specific data tables
- Comprehensive guides
Optimize for the engagement type that aligns with your goal. Retweet-optimized content drives reach. Reply-optimized content drives conversation. Bookmark-optimized content drives long-term quality signal.
Common Engagement Misreadings
Five patterns that confuse engagement meaning.
- Treating all engagements as equal: 100 likes is not equivalent to 100 retweets in algorithmic weight
- Comparing absolute counts across account sizes: 50 engagements on a 1,000-follower account is excellent; 50 engagements on a 100,000-follower account is concerning
- Confusing impressions with engagements: impressions are views; engagements are interactions. High impressions with low engagements signals weak content quality
- Mistaking velocity for total: a post with 1,000 engagements over 7 days performs much worse algorithmically than a post with 100 engagements in the first 30 minutes
- Ignoring engagement composition: 100 likes alone is weaker than 50 likes with 20 replies and 10 retweets
According to Metricool's 2026 study of 1.1 million X posts, accounts that read engagement composition correctly (prioritizing replies and retweets over likes) grew 2-3x faster than accounts optimizing for total engagement counts alone.
The 2026 Engagement Strategy Workflow
A 30-minute daily workflow that turns engagement understanding into growth.
Morning Block (10 minutes)
- Engage with 5-10 niche peer tweets via substantive replies
- Quote-retweet 1 peer post with added perspective
- Bookmark 3-5 tweets worth referencing later
Publish Block (15 minutes)
- Publish your daily post during peak window (Tuesday-Thursday 12-6 PM)
- Reply to early commenters within 5-10 minutes
- Activate community amplification if you use one
Evening Block (5 minutes)
- Review engagement composition on the day's post
- Note which content patterns drove which engagement types
- Plan tomorrow's content based on what worked
Compounding effect: 365 days × 30 minutes = 180 hours per year of focused engagement work. Properly executed, this produces 30-50% engagement rate growth quarter over quarter.
How to Read Your Engagement Dashboard
X's native dashboard at analytics.x.com surfaces engagement counts; reading them right matters.
Step 1: Pull Last 7 Days
Sort posts by engagement rate, not by total engagements.
Step 2: Identify Top 3 vs Bottom 3
What format, time, topic, hook did top posts share? What pattern do bottom posts share?
Step 3: Check Engagement Composition
Top posts with high retweet count signal viral capability. Top posts with high reply count signal conversation strength. Top posts with high bookmark count signal reference value.
Step 4: Apply Insights to Next Week
Replicate what worked. Cut what didn't. Iterate.
Our Twitter analytics guide covers the broader framework that this weekly review fits into.
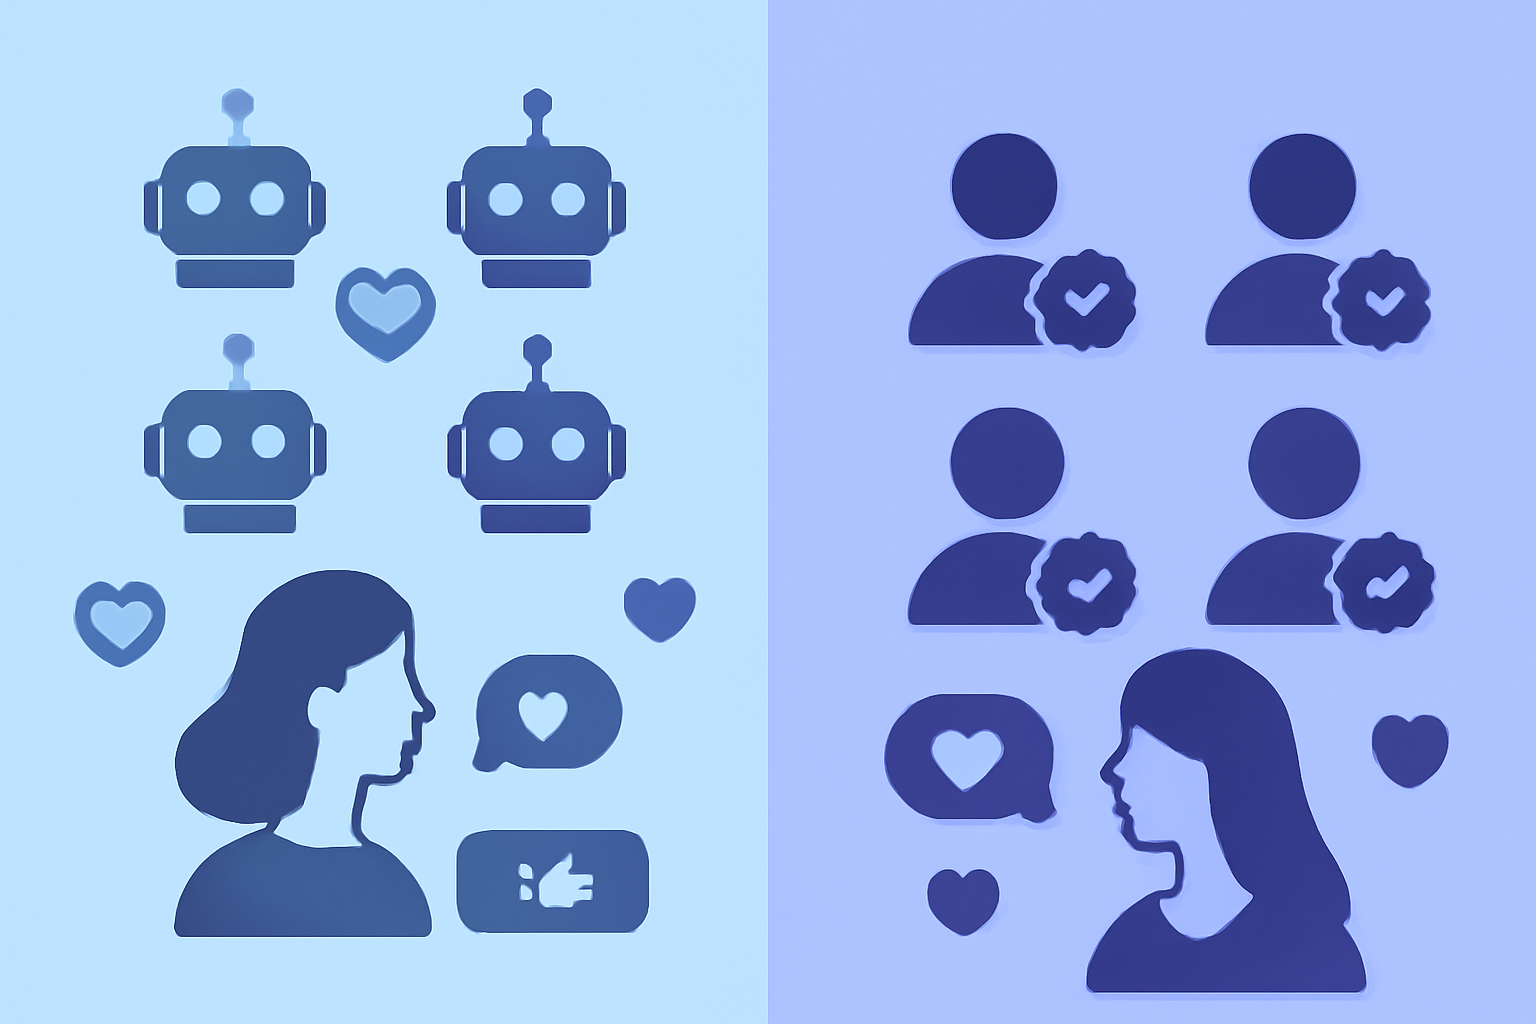
How Xarmy Drives Quality Engagement
The 2026 reality: understanding what engagements mean is foundational; capturing first-30-minute velocity from real verified accounts is what drives actual growth.
Our AI-powered platform generates content optimized for high-weight engagement types (retweets, quote tweets, replies, bookmarks) and provides community-driven engagement from 10,000+ verified creators who engage authentically within the 30-minute velocity window. The community engagement spans all interaction types: not just likes, but substantive replies, retweets, quote tweets, and bookmarks. Average reach lift: 450%, comparable to results from $3,000+/month agency services at a fraction of the cost.
For solo creators, brands, and B2B operators serious about X, understanding what engagements mean is foundational; combining that understanding with community-driven velocity from real accounts is what consistently produces compounding growth.
Frequently Asked Questions
What do Twitter (X) engagements actually mean in 2026?
Engagements are any user interactions with a tweet: likes, replies, retweets, quote tweets, bookmarks, link clicks, profile clicks, hashtag clicks, and media views. The algorithm uses engagement (especially first-30-minute velocity) as the strongest signal to decide whether to amplify a post to non-followers. In 2026, retweets carry the highest algorithmic weight (+35% YoY growth), followed by quote tweets (+28%), bookmarks, and substantive replies (+21%). Likes are the lowest-weight engagement type for algorithmic purposes.
Are likes more or less important than retweets on X in 2026?
Retweets are significantly more important than likes for algorithmic amplification in 2026. Retweets grew 35% YoY while likes grew only 8%, reflecting the algorithm's increased weighting of share-driving content. Likes function primarily as social proof for profile visitors; retweets drive both algorithmic boost and audience expansion. Strategic content optimizes for retweet-worthy patterns (specific numbers, frameworks, hot takes) over like-driving patterns (relatable observations, emotional triggers).
What is a good engagement rate on Twitter (X) in 2026?
Median brand engagement on X is 0.015% according to Sprout Social's 2026 industry data. Anything above 0.05% is strong for brands; sports accounts top out at 0.073%. Individual creators routinely achieve 1-5% engagement rate, with exceptional accounts sustaining 5%+. Calculate as (total engagements / total impressions) × 100. Compare against your own historical baseline rather than against industry averages, since account size and niche significantly affect benchmarks.
Understanding what do Twitter engagements mean in 2026 is the foundation of every growth strategy on X. Read engagement types and composition, prioritize retweets and replies over likes, capture first-30-minute velocity, and the algorithm compounds returns over months. Try our AI-powered platform for free to combine engagement-optimized content with real velocity from 10,000+ verified creators, the formula that consistently drives every engagement type that matters.